 <Click for a quick summary of the analysis via an infographic>
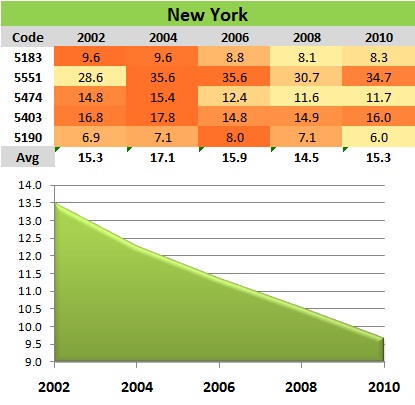
State Trends – WC Rates Mostly Trending Lower
Here is a look at how the average of our five construction WC rates have changed over time by state. As you can see by the data below, California and Florida have had major decreases in WC rates. New Jersey has had a moderate increase since 2002, and Texas had a moderate decrease in WC rates. New York has been up and down with 2010 rates coming in almost identical to 2002 levels.


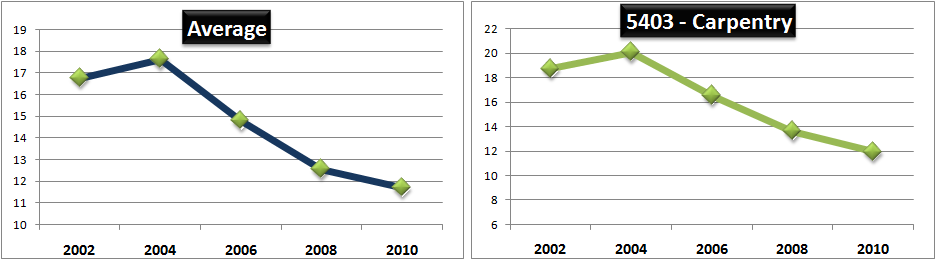
Construction WC Codes – Trends Over Time
Here is a look at the history of the five WC codes we used in our analysis. As you can see, all codes had a slight increase in 2004, then a significant decrease in 06, 08 & 2010. Per Oregon Department of Consumer & Business Services findings, 2010 WC rates were the lowest in recent history. Have we reached the floor, or will WC rates continue to decrease in the future?


2010 WC Rates
Where are we at today? Here is a look where WC rates were in 2010. The map of the United States indicates average work comp rates by state over 50 of the largest occupational classes.

Below is a quick look at the 2010 rates by state and WC code.


